Introduction
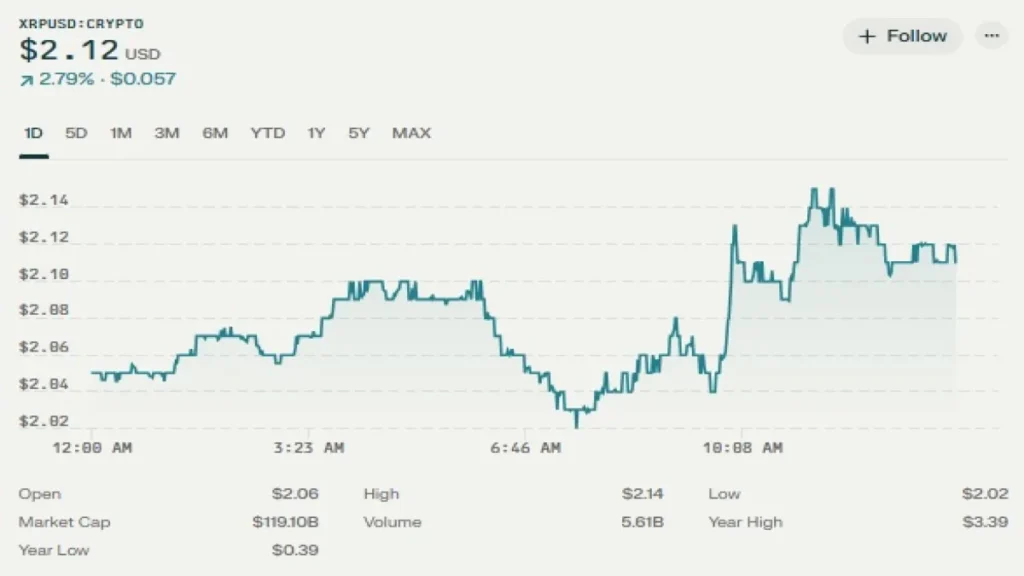
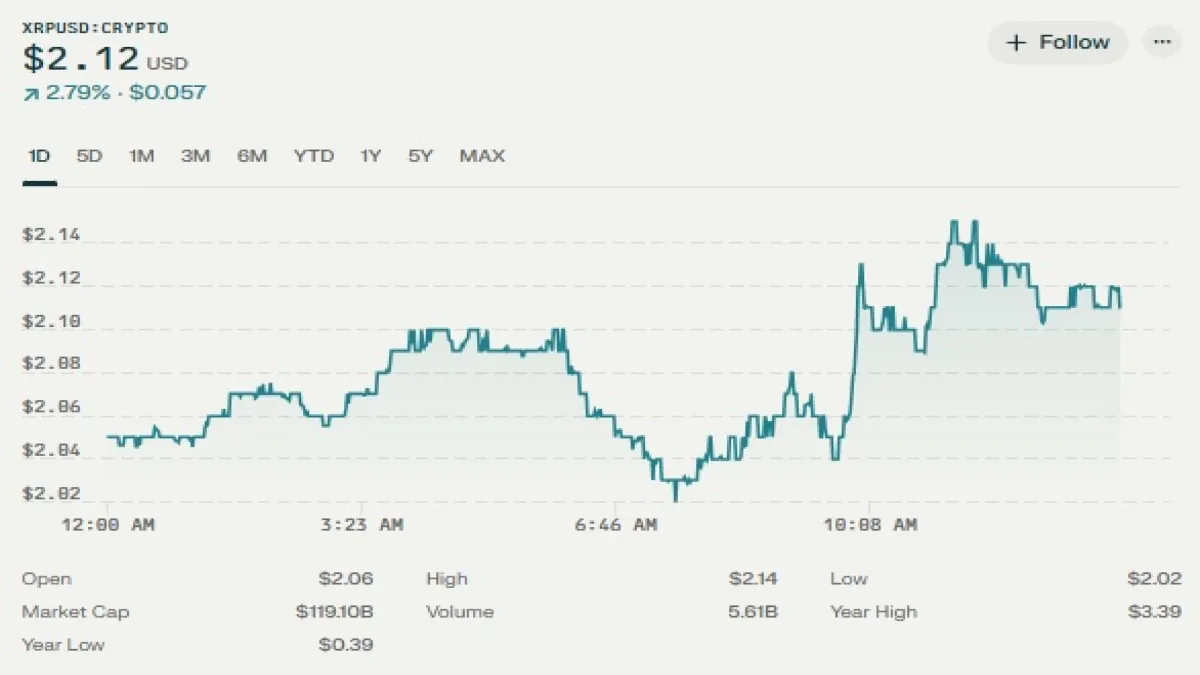
The cryptocurrency market is bracing for potential volatility as analysts closely monitor the XRP price correction potential. Currently trading at $2.12 with a 2.79% gain in the last 24 hours, XRP sits at a critical technical juncture that could determine its near-term trajectory.
While the digital asset has shown resilience amid recent market fluctuations, several warning signs suggest an impending correction may be on the horizon. Technical indicators reveal mixed signals, with the price hovering near key support levels while showing signs of weakening momentum.

Market sentiment remains cautious as traders weigh the impact of ongoing regulatory developments and broader crypto market trends. This analysis will examine the crucial price levels to watch, evaluate expert predictions, and assess whether XRP is poised for another bullish breakout or facing a significant pullback. Understanding these dynamics is essential for investors looking to navigate the potential risks and opportunities in XRP’s volatile market environment.
In this analysis, we’ll examine:
✅ Technical indicators signaling an XRP price correction potential
✅ Expert price predictions (bullish vs. bearish scenarios)
✅ Key support & resistance levels to watch
✅ Historical patterns and regulatory impacts
✅ Real-time data and actionable insights for traders
Current XRP Market Snapshot (Live Data)
| Metric | Value |
|---|---|
| Price | $2.12 |
| 24h Change | +2.79% |
| 24h Low/High | $2.02 / $2.15 |
| Market Cap | $119.01B |
| Year High | $3.38 |
| Year Low | $0.39 |

(Source: CoinMarketCap, updated April 2025)
Technical Analysis: Signs of XRP Price Correction Potential
Several indicators suggest XRP could face a short-term pullback:
1. Moving Averages (MA)
- 50-day MA: $2.38 (Resistance level)
- 200-day MA: $1.81 (Strong support)
- If XRP breaks below $2.00, a deeper correction toward $1.80 is possible.
2. Bollinger Bands
- XRP is hovering near the mid-band ($2.10), indicating consolidation.
- A close below $2.05 could trigger a bearish reversal.
3. RSI & MACD
- RSI: 58 (neutral, but nearing overbought territory)
- MACD: Slight bullish crossover, but weakening momentum
4. Support & Resistance Levels
| Key Levels | Price | Significance |
|---|---|---|
| Resistance | $2.24 | Breakout target |
| Support | $2.00 | Critical hold |
| Strong Support | $1.85 | Correction floor |
Expert Predictions: How Low Could XRP Go?
Analysts are divided on XRP’s near-term trajectory:
🔴 Bearish Scenario (XRP Price Correction Potential)
- Target: $1.79–$1.90
- Triggers:
- Loss of $2.00 support
- Broader crypto market downturn
- Negative Ripple lawsuit developments
🟢 Bullish Rebound Case
- Target: $3.00–$3.78
- Triggers:
- Break above $2.24 resistance
- Favorable regulatory news
- Bitcoin-led market rally
🟡 Neutral Outlook (Volatility Expected)
- Egrag Crypto predicts XRP could swing between $1.90–$3.00 in April 2025.
Historical Patterns: XRP Corrections & Recoveries
XRP has a history of sharp corrections followed by strong rebounds:
- 2017: Dropped -65%, then rallied +1,000%
- 2020: Fell -55%, later surged +700%
- 2023: Corrected -40%, rebounded +300%
This pattern suggests that if an XRP price correction potential materializes, it may present a buying opportunity.
Market Sentiment & Regulatory Risks
- Ripple vs. SEC Case: A negative ruling could trigger selling.
- Crypto Market Trends: Bitcoin’s dominance impacts XRP’s momentum.
- Institutional Adoption: New partnerships could boost prices.
Conclusion: XRP price correction potential Next Move
The XRP price correction potential remains a key discussion among traders. Key takeaways:
- Immediate Support: $2.00 (hold = bullish, break = bearish)
- Worst-Case Drop: $1.79–$1.85
- Upside Target: $3.00+ if bullish momentum resumes
Final Price Outlook:
| Scenario | Price Range | Likelihood |
|---|---|---|
| Bullish | $2.50–$3.78 | 35% |
| Neutral | $1.90–$2.24 | 45% |
| Bearish | $1.79–$1.85 | 20% |
FAQ: XRP Price Correction Potential
1. What triggers an XRP price correction?
- Overbought RSI, weak support levels, or broader market sell-offs.
2. Is XRP a good buy before a correction?
- Risk-tolerant traders may wait for a dip near $1.85–$2.00 for better entries.
3. Can XRP drop below $1.50?
- Unlikely unless Bitcoin crashes or Ripple faces major regulatory setbacks.
4. When will XRP rebound after a correction?
- Historically, rebounds occur within 2–8 weeks after a drop.
5. What’s the long-term XRP price prediction?
- Analysts target $5–$10 by 2026 if adoption grows.
Also Read | https://cryptonewsrank.com/xrp-volume-on-upbit-record-march-2025/?amp=1


